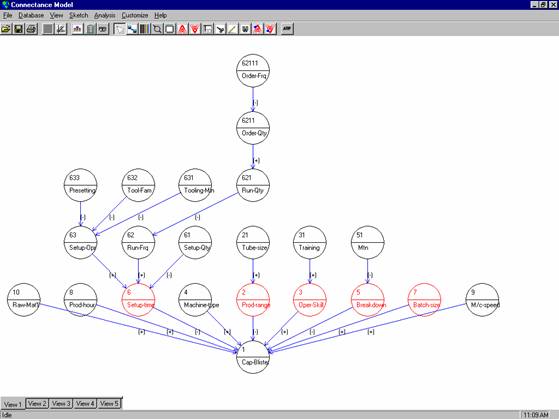
Figure 1: Capacity Variable Connectance Network for Packing Plant
| Strategy phase: | Development |
| Level: | Department |
| Primary content: | Production variables |
| Thinking types: | Divergent - convergent |
| Main benefits of visualization: | Cognitive (variable linkages, cause and effect), social (communication, building consensus) |
| Visual format used: | Elaboration technique: Tool for Action Plan Selection, (TAPS) |
A leading company in the field of innovative thermosetting polymers, with a turnover of £115 million and employing 300 people was forecasting an increase in demand and was looking into ways of increasing its existing capacity. The managers knew that the existing packing plant capacity was under-utilised and they wanted to find a solution to increase capacity utilisation. The company used the TAPS tool to help them identify the most appropriate actions, which were then implemented.
TAPS is a software tool based on the connectance concept, developed by John Burbidge (Burbidge,1984). It enables users to build a network diagram to represent the inter-relationships between a production variable and its connected variables. In the network diagram the variable is displayed as a node with arrows linking it to other nodes. Arrows connect variables to indicate the existence and direction of a connectance. A customisable database holds information on both the variables and their relationships (the nodes and arrows). Analysis tools enable the users to ‘trace-up’ or ‘trace down’ from any variable in the network. This allows the impact of changes in variables to be readily visualised. Interactive graphic features include sketching and node editing functions (size, colour, move, rename etc.) which enable the user to modify the network hierarchy display. For more detail see, for example, Tan and Platts (2003).
In use, a multi-functional group of workers created a model of the variables affecting the capacity of the packing plant. Using a video projector attached to a PC, and running the software tool, the participants were able to follow the construction of the cause-effect diagram step-by-step. This was a very interactive process because each participant had their own views of the way in which variables interacted one with another. Careful discussion was required to ensure that only first order connectance (i.e. direct effects) were recorded. The comprehensive editing tools enabled rapid modifications to the diagram. The finished diagram is shown below.
Once a consensus was reached, the group went on to identify attributes of the variables and connectances, for example, the strength of the relationships, the time taken for an effect to manifest itself following a change, the cost of making a change etc. This information was recorded and could be displayed as required on the diagram. Using the vizualisation and the analysis tools the group considered the potential actions that could be taken and their likely impacts. From this they identified short and long term action plans.
Figure 1: Capacity Variable Connectance Network for Packing Plant
The main advantage of the TAPS visualization tool within the action planning process is that it provides participants with a way of formalising, capturing, and sharing their mental models. The visualisation, facilitated by the software tool, enables a group of managers to share and develop an agreed understanding of the way in which a system operates. The visual network diagram assists them in getting an overall view of the variables involved and their cause-effect relationships. This prompts discussion on three levels: first, defining and understanding individual variables; second, identifying variable linkages; and third, characterising and evaluating the attributes of the linkages. Using the visualisation, managers are able to explain the logic behind a set of improvement actions. The ability of the software to filter, based on variables or linkages, is extremely useful when trying to make sense of, and communicate the behaviour of, very complex systems. Thus the visualisation tool imposes structure, providing a clear and systematic approach to analyzing, diagnosing and developing solutions to a particular problem. The database functions of the tool allow users to store visual models for later re-use or adaptation. A further advantage of the visualisation is that it allows managers to communicate actions and the rationale behind them to other staff.
In terms of potential disadvantages, there may be initial reluctance to use the software for several reasons. Firstly, there is a learning curve associated with it. Although the software is intuitive and icon driven, it still takes several hours to become an adept user. Secondly, there may be an initial fear of a ‘black box’ solution. This can be rapidly overcome when it is realised that the software does not do any decision making but instead provides users with a way of manipulating and displaying data that has many advantages over traditional methods of flipcharts, whiteboards etc.
Communication and subsequent discussion of visual models is greatly enhanced by the ability to manipulate the models in real time. The use of a computer with video projection provides a simple and quick way of achieving this. Such discussions lead to the building of shared consensus models that form the basis for subsequent analysis. However, using custom software for visualization will require a learning curve which may discourage its use. Therefore the software must be intuitive with a user friendly interface.
Secondly, visual models are very useful in explaining the logic behind actions in complex environments. Software with filtering capability is particularly valuable in this role.
Finally, there are social benefits related to the use of visualisation. The use of a visualization tool allows individuals with differing perspectives, values, and beliefs to make sense of actions that might otherwise appear inappropriate. This builds understanding and improves group cohesion.