visual-literacy.org: Business
Topic outline
-
Welcome to DemoModule: VizBiz
Instructors: Martin Eppler, Remo Burkhard, Ralph Lengler & Patricia Klarner
-
from Module 1: VizIntro

The VizHall is a learning resource which will help you to improve your assessment skills. It can be used to familiarize yourself with a subject or to assess the visualizations of your fellow students (peers). Let's start with four examples.
Steps:
-
Look at each visualization for 2 seconds. Then close your eyes. Open your eyes again and write down your first impressions.
-
Have again a closer look at the visualization. Do you like it? What could be the message? Is it consistent? What could it be used for?
-
Now read the description of the context and try to understand how the visualization was actually used.
-
Finally, rate the visualization with the interactive check boxes.
-
-
from Module 2: VizBasics

What can you see in this picture? How is it possible that our brain re-constructs the hidden meaning in this series of dots? What are the laws that govern this reconstruction process? Click on the links below to find out more about how our brain deals with ambiguous or incomplete graphic information.
-
from Module 2:Vizbasics
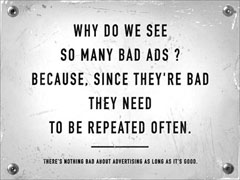
Self promotion of an ad agencyAn easy and entertaining way to improve your (passive) visualization skills is by assessing visualizations from others. Hence, we would like to ask you to explore and assess the collection of ads provided below. Look at each ad carefully, observe your spontaneous reaction, as well as your emotional and analytical response to the ad. Then try to rate the advertisment through the scales that are provided and leave a short comment on your evaluation.
-
from Module 4: KnowViz

In this section you will learn more about where and how to employ knowledge visualization. You will be able to read a short introduction to the field of knowledge management. You will also explore the conceptual framework mentioned previously that structures knowledge visualization into relevant key questions. In the final part of this section you will learn about the notion of "complementary visualization" and how different visual formats can work together to convey a complex message.
-
from Module 5: ComViz

Let's learn about visualization for business communication by witnessing an authentic communication event that discusses the communicative challenges of managers and experts. Sit in, listen and learn about key problems, concepts, and practical solutions to improve communication for decision making through visualization. And become a critic and keen observer of some of the more problematic aspects of visual online communication. -
from Module 8: BizViz

Having ideas is the first step to creating added value. It is therefore important that you first have a vision, idea, or passion and only secondly understand the fields in detail. If you do it vice versa you might get brainwashed and do it as everyone is doing it for years. Be creative, believe in your ideas. Before we start, try to rate the potential of visualization in 10 Business Areas and compare it with the ratings of your peers.
-
from Module 7: StratViz
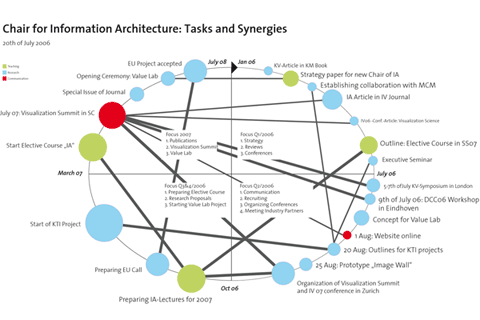
In this section you can see different visual approaches to business challenges: -
From Module 7: StratViz

Now, let’s look at a few real life cases, where visualization was important for facilitating the strategic management process. -
from Module 8: BizViz
In this exercise you are asked to re-invent the organization chart for improved business communication. The classical org chart emphasizes levels of hierarchy and is thus not always highly motivating or instructive. Think about novel ways to represent an organization's structure that higlights how people actually work together and that does not stress hierarchic levels. The org chart should be usable both for internal and for external communication.
Here you can see the results of the first field test of the VizHall. The examples and the ratings, and the comments are of corporate communication master students of a course in business knowledge visualization at the university of Lugano.